How to Add Analytics to Your Lovable Project (Step-by-Step Guide)
Lovable's built-in analytics only show basic pageviews. Here's how to add full visitor tracking, custom events, error monitoring, and revenue attribution to any Lovable app in under 5 minutes.

You built your app with Lovable in minutes. It looks great, it works, and it’s live.
But now what? Who’s actually using it? Which pages do they visit? Where did they come from? Are they hitting errors you don’t know about? And if you’re charging for it — which users are converting to paying customers?
Lovable’s built-in analytics give you the basics — pageviews, bounce rate, traffic sources. But if you’re serious about growing your product, you need more. You need to track custom events, identify users, monitor errors, and connect your analytics to your revenue.
That’s where Himetrica comes in. It’s an analytics platform built for modern web apps — and it takes less than 5 minutes to add to any Lovable project.
Why Lovable’s built-in analytics aren’t enough
Lovable includes a basic analytics dashboard for published projects. It covers:
- Visitor counts and pageviews
- Bounce rate and visit duration
- Traffic sources
- Device breakdown
That’s useful for a quick sanity check. But it doesn’t tell you:
- Which features users actually engage with (custom event tracking)
- Who your users are (user identification by name/email)
- What’s breaking (error tracking and monitoring)
- Which visitors become paying customers (revenue attribution)
- How your Core Web Vitals perform (LCP, CLS, INP)
- Which marketing channel drives the most revenue, not just the most traffic
If you’re building a SaaS, marketplace, or any product where user behavior matters, you need analytics that go deeper than pageviews.
What you’ll get after this tutorial
By the end of this guide, your Lovable app will have:
- Automatic page view tracking — including SPA navigation (React Router, etc.)
- Custom event tracking — track signups, button clicks, purchases, anything
- User identification — connect anonymous visitors to real users
- Error monitoring — catch uncaught exceptions and unhandled promise rejections
- Core Web Vitals — LCP, CLS, INP, FCP, TTFB reported automatically
- Session management — understand user sessions with configurable timeouts
- Lightweight — fast, async loading that won’t affect your page speed
Before you start
You’ll need:
- A Lovable project (any plan)
- A free Himetrica account — takes 30 seconds to set up
- Your Himetrica API key (found in your project settings)
Create your Himetrica account
Head to himetrica.com and click Get Started. You can sign up with Google, GitHub, or email.
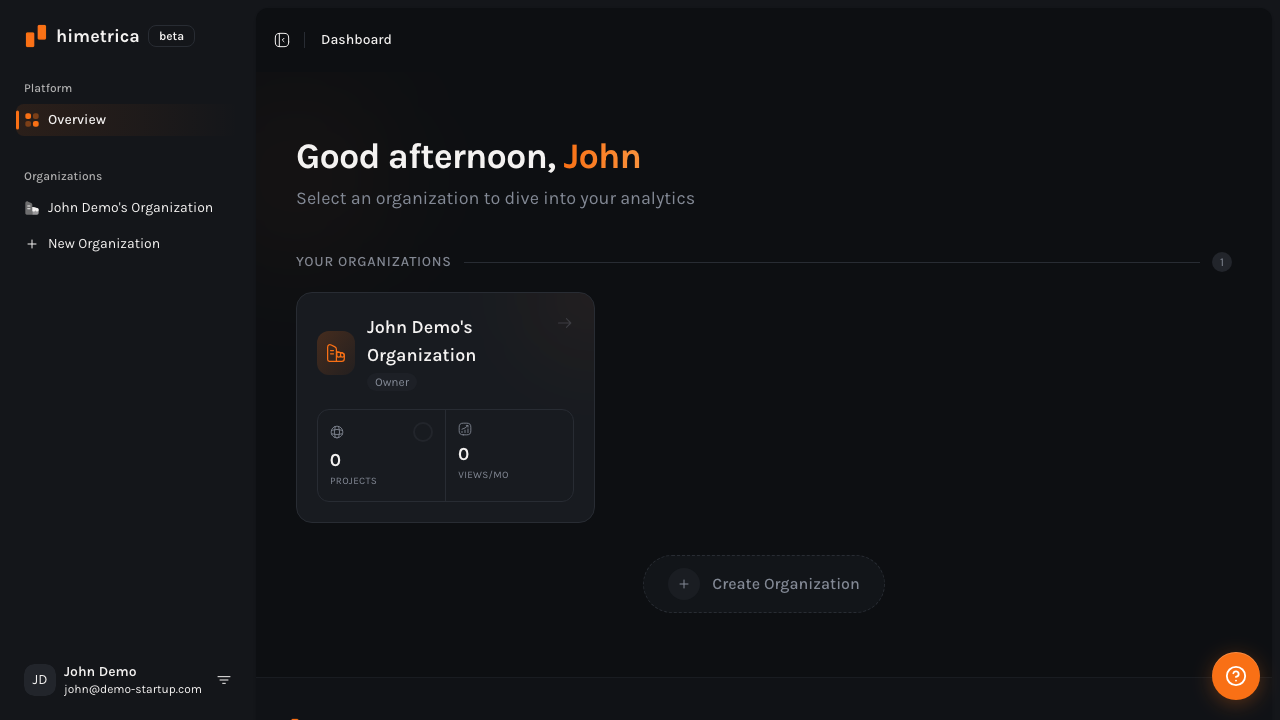
Once you’re in, you’ll land on your dashboard. Click on your organization, then create a new project for your Lovable app.
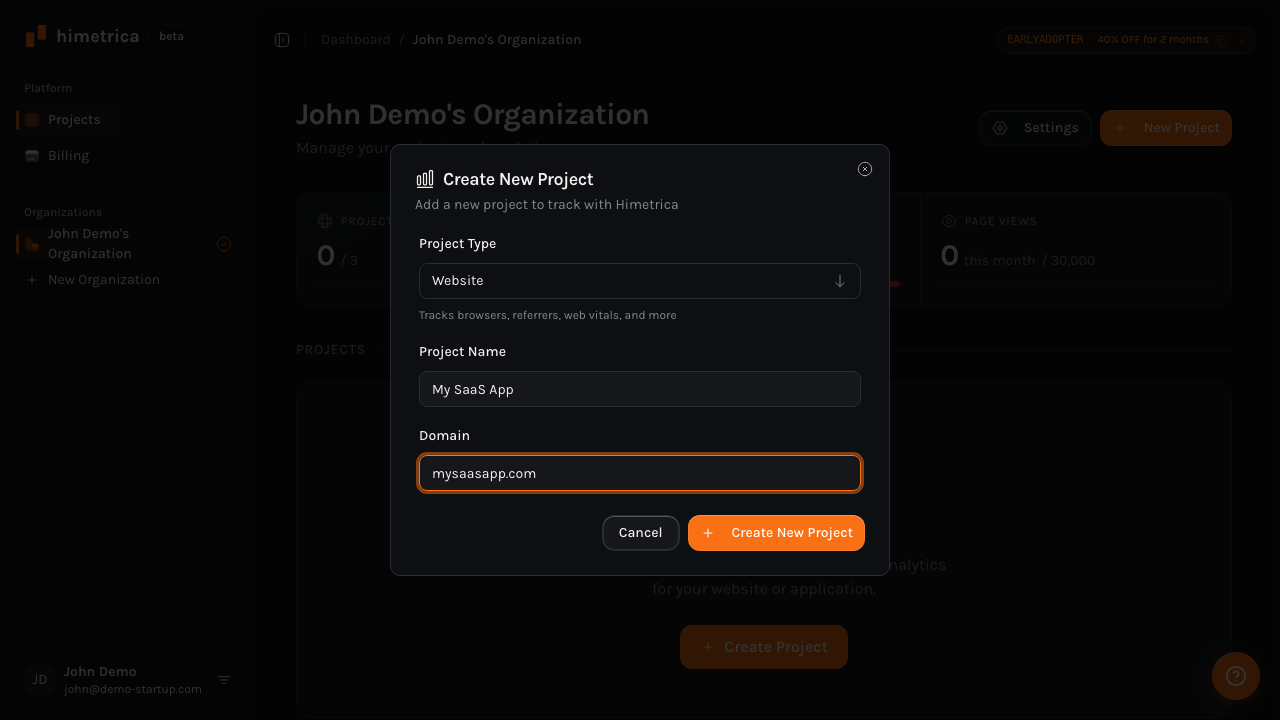
Give your project a name and the domain where your Lovable app is deployed.
After creating your project, copy your API key from the project settings — you’ll need it in the next step.
Method 1: Install the NPM package (recommended)
Since Lovable generates standard React + Vite projects, the cleanest approach is installing the @himetrica/tracker-js package. You can do this either through Lovable’s AI chat or by editing the code directly.
Step 1: Install the package
Open your Lovable project and tell the AI:
“Install the @himetrica/tracker-js package”
Or if you’ve exported to GitHub and are working locally:
npm install @himetrica/tracker-jsStep 2: Wrap your app with the provider
Lovable projects use React, so you can use the built-in React provider. Find your main App.tsx file and wrap your app component:
import { HimetricaProvider, HimetricaErrorBoundary } from "@himetrica/tracker-js/react";

function App() {
  return (
    <HimetricaProvider
      apiKey="your-api-key-here"
      autoTrackErrors
      trackVitals
    >
      <HimetricaErrorBoundary fallback={<div>Something went wrong</div>}>
        {/* Your existing app components */}
        <MainApp />
      </HimetricaErrorBoundary>
    </HimetricaProvider>
  );
}
That’s it. With just those two components, you get:
- Automatic page view tracking (SPA-aware — works with React Router)
- Error tracking (uncaught exceptions and unhandled rejections)
- Core Web Vitals reporting
- Session management
Step 3: Track custom events
Want to know when someone clicks a specific button, completes a signup, or starts a checkout? Use the useTrackEvent hook:
import { useTrackEvent } from "@himetrica/tracker-js/react";

function SignupButton() {
  const trackEvent = useTrackEvent();

  const handleSignup = () => {
    trackEvent("signup_completed", { plan: "free" });
    // ... your signup logic
  };

  return <button onClick={handleSignup}>Sign Up Free</button>;
}
Step 4: Identify users
Once a user signs up or logs in, connect their anonymous visitor history to their real identity:
import { useHimetrica } from "@himetrica/tracker-js/react";

function Dashboard() {
  const hm = useHimetrica();

  useEffect(() => {
    // Call this after login/signup
    hm.identify({
      name: user.name,
      email: user.email,
      metadata: { plan: user.plan },
    });
  }, [user]);

  return <div>...</div>;
}
Now you can see the full journey: which pages they visited before signing up, which campaign brought them in, and everything they do after.
Method 2: Add a script tag in index.html
If you’d rather not install an NPM package — or you want the simplest possible setup — you can add the Himetrica tracker directly to your index.html file.
Step 1: Open index.html
In your Lovable project, find the index.html file in the root directory. You can do this through Lovable’s code editor or tell the AI:
“Add this script tag to the head of index.html”
Step 2: Add the tracker script
Paste this inside the <head> tag:
<script
  defer
  data-api-key="your-api-key-here"
  src="https://tracker.himetrica.com/tracker.js"
></script>
That’s the entire setup. The script automatically tracks page views, sessions, and referrers. It’s lightweight (under 5KB), loads asynchronously, and won’t affect your page speed.
When to use each method
| NPM Package | Script Tag | |
|---|---|---|
| Custom events | Full support with hooks | Requires window.himetrica.track() |
| User identification | React hooks built-in | window.himetrica.identify() |
| Error tracking | Automatic with provider | Automatic |
| Core Web Vitals | Configurable per-option | Automatic |
| TypeScript support | Full type definitions | None |
| Best for | React apps, SPAs, production apps | Landing pages, quick prototypes |
Our recommendation: If your Lovable project is a real product you’re shipping to users, use the NPM package. If it’s a landing page or quick prototype, the script tag is fine.
What to track in your Lovable app
Once you have Himetrica installed, here are the events worth tracking for a typical Lovable-built SaaS or web app:
Activation events
trackEvent("signup_completed", { method: "google" });
trackEvent("onboarding_finished", { steps_completed: 5 });
trackEvent("first_value_moment", { feature: "dashboard" });
Engagement events
trackEvent("feature_used", { feature: "export", format: "csv" });
trackEvent("search_performed", { query: searchTerm, results: count });
trackEvent("settings_changed", { setting: "notifications" });
Conversion events
trackEvent("pricing_page_viewed", { source: "navbar" });
trackEvent("checkout_started", { plan: "pro", interval: "monthly" });
trackEvent("upgrade_completed", { from: "free", to: "pro" });
Error context
import { useCaptureError } from "@himetrica/tracker-js/react";
function DataLoader() {
const captureError = useCaptureError();
useEffect(() => {
fetchData().catch((err) => {
captureError(err, { component: "DataLoader", userId: user.id });
});
}, []);
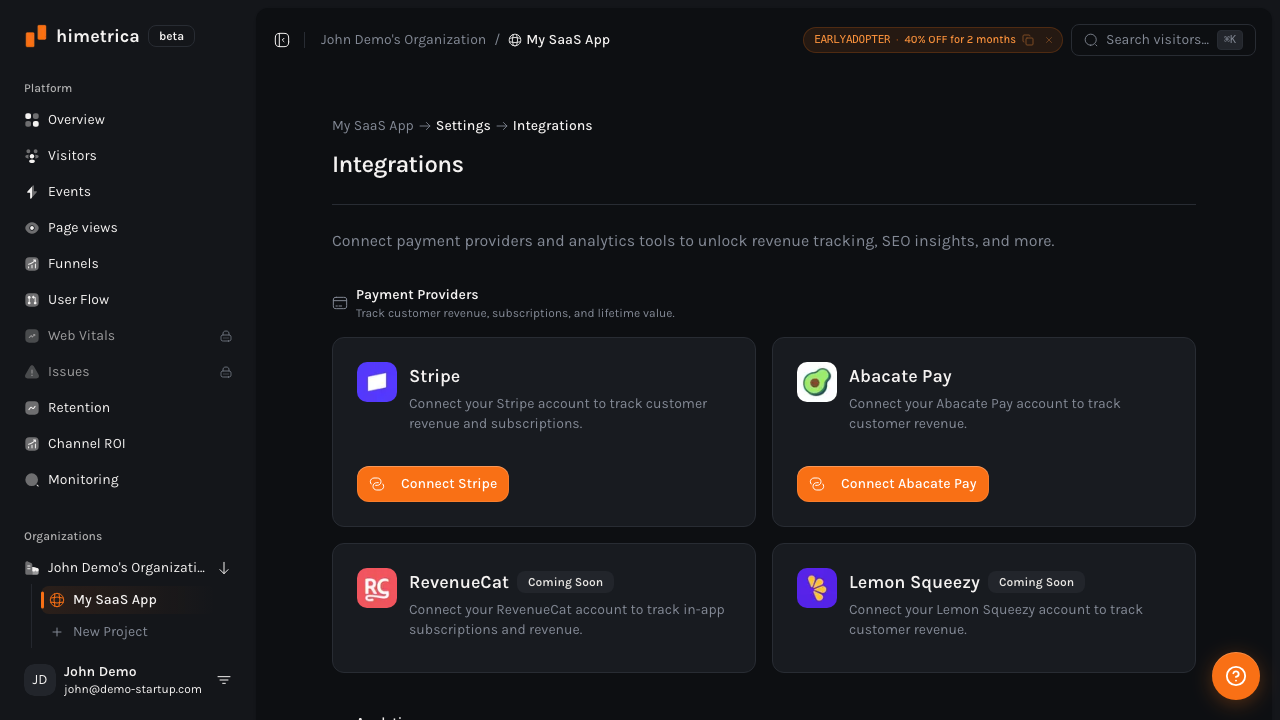
}Connect your revenue (optional but powerful)
If your Lovable app charges users through Stripe, you can connect Stripe to Himetrica and see which visitors actually become paying customers.
This means you can answer questions like:
- Which landing page produces the highest-LTV customers?
- Which traffic source drives the most MRR?
- What do your best customers have in common before they convert?
The setup takes two minutes — check out our full Stripe integration tutorial for the step-by-step walkthrough.
Himetrica vs. other analytics options for Lovable
If you’re evaluating analytics tools for your Lovable project, here’s how the options compare:
| Feature | Himetrica | Lovable Built-in | Google Analytics | Plausible |
|---|---|---|---|---|
| Page view tracking | Yes | Yes | Yes | Yes |
| Custom events | Yes | No | Yes | Limited |
| User identification | Yes | No | Limited | No |
| Error tracking | Yes | No | No | No |
| Core Web Vitals | Yes | No | Yes | No |
| Revenue attribution | Yes | No | No | No |
| React hooks & provider | Yes | N/A | No | No |
| AI-powered insights | Yes | No | Limited | No |
| Setup time | ~3 min | Built-in | ~10 min | ~5 min |
Troubleshooting
”My page views aren’t showing up”
The Himetrica tracker doesn’t track on localhost by default. Deploy your Lovable app and check the dashboard after visiting the live URL. If you need local testing, you can use the NPM package and set up a custom API endpoint.
”Events fire twice on navigation”
This usually happens if you have both the script tag and the NPM package installed. Pick one method and remove the other.
”I can’t install NPM packages in Lovable”
Tell the Lovable AI: “Add @himetrica/tracker-js as a dependency in package.json and run npm install.” If that doesn’t work, use Method 2 (script tag) or export your project to GitHub and install locally.
”My API key is visible in the source code”
That’s expected and safe. The API key is a public key — it only has permission to send tracking data to your specific project. It cannot read data, delete anything, or access your account. This is the same pattern used by every client-side analytics tool.
What’s next
Once you’ve got Himetrica running in your Lovable project:
- Set up your first dashboard — check visitor trends, top pages, and traffic sources
- Add custom events for your key user actions (signups, feature usage, conversions)
- Identify users after login to connect anonymous sessions to real people
- Connect Stripe if you’re charging users — see the full visitor-to-customer journey
- Share your dashboard with your team using Himetrica’s sharing features
You built your app fast with Lovable. Now you’ll know exactly who’s using it, what they’re doing, and what’s working.
Ready to get started? Create your free Himetrica account and have analytics running in your Lovable app in under 5 minutes.
Himetrica Team
Published on March 20, 2026